As with all large data sets, filtering is necessary to analyze, inspect and diagnose the system. In this article, you will learn about journalctl’s advanced filtering options which could be very useful for system administrators.
What is journalctl?
journalctl is a command line tool used for viewing logs which are collected by systemd. These logs are collected in a central repository for easy display, review and reporting. The journal’s log records are well indexed and structured in a way that allows system administrators to easily analyze and manipulate the large log records. Filtering options of journalctl enables users to sift through the large sets of log entries in order to find specific messages, alerts, errors which are specific to certain applications , users, services…
How to find all the filtering fields of journalctl ?
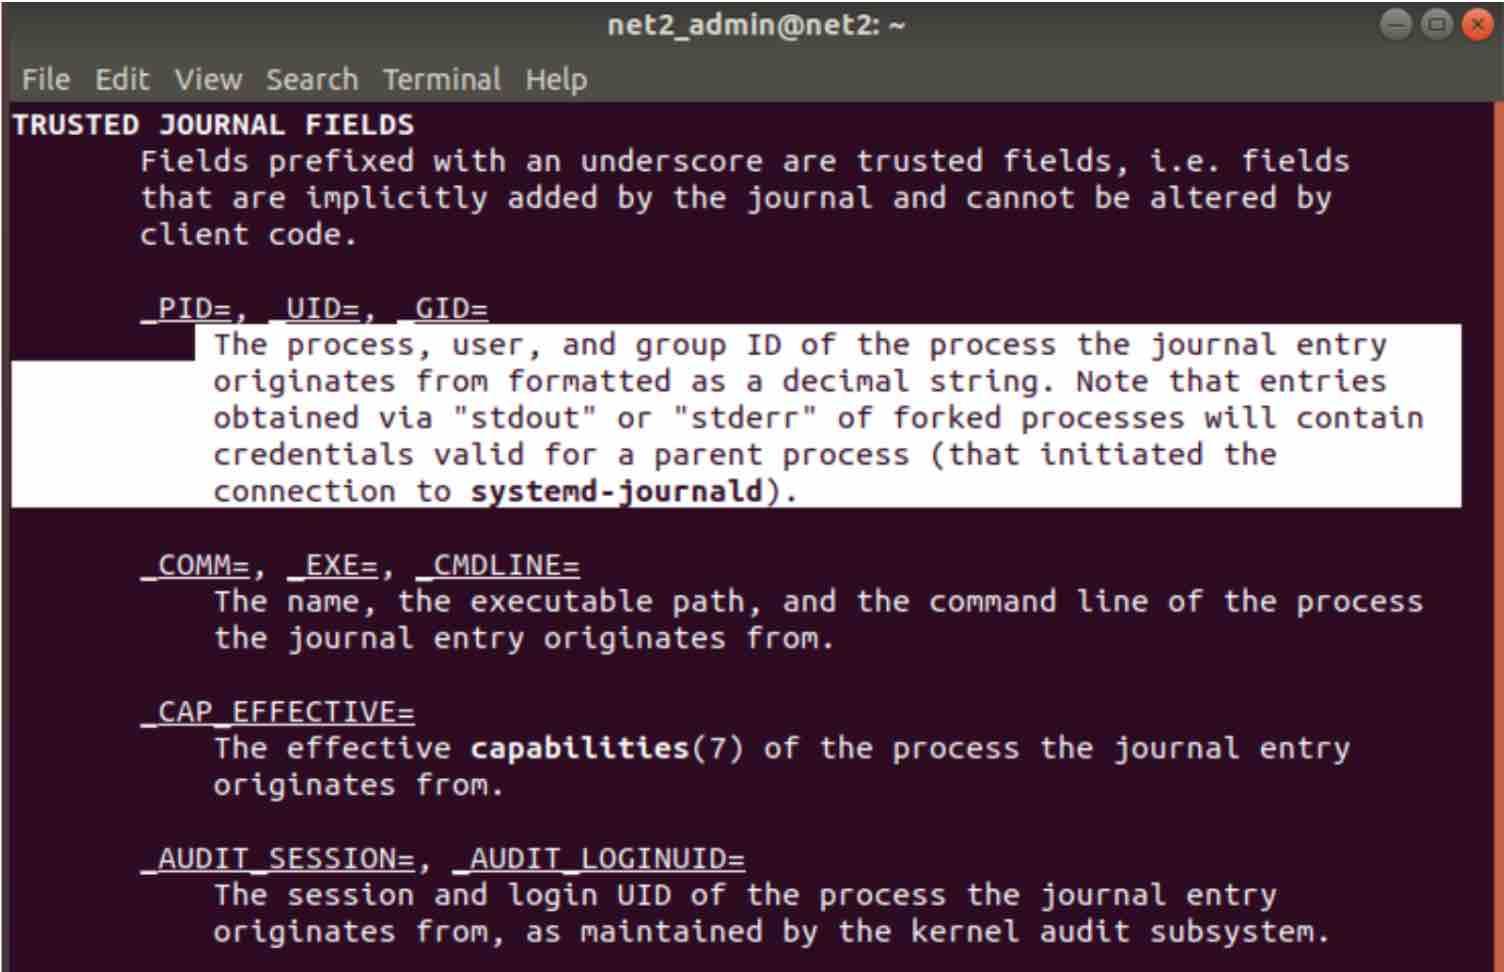
In the sections below, we are going to see many filters we will be using with the journalctl command. You will be able to see all available journal fields by typing in the command :
man systemd.journal-fields
1 – Time Window
Oftentimes, system administrators might need to know precisely the set of events that occurred during a specific time window within a log boot session with significant uptime.
In order to filter by time limits, you could use the options –since and –until which instruct the journalctl to bring up the logs which occurred after or before the specific time respectively.
If for instance, you would like to see all the log entries since March 11th, 2019 at 15:05 PM, you could run the command below:
journalctl –since “2019-03-11 15:05:00”
The time format is the following :
YYYY-MM-DD HH:MM:SS
if the date field is omitted, the current date will be applied. If the time value is missing, “00:00:00” will be used. The seconds component default value is “00” when omitted.
The –since and –update can be used within the same command to specify an interval for instance :
journalctl –since “2019-03-11 15:05:00” –until “2019-04-11 15:05:00”
Journalctl is smart. It can for example understand words like “ago”, “today”, “yesterday”, “now”, “tomorrow” as shown below :
For instance, to retrieve the log data from yesterday, type in the command below:
journalctl –since yesterday
or the following command :
journalctl –since 23:00 –until “1 hour ago”
which is self explanatory.
2 – Most recent reboot logs
In order to view the collected logs since the last reboot of the system, use the -b switch as follows :
journalctl -b
This will enable you to analyze situations that are related to events that occurred since the most recent reboot. Note that between-reboot sections in the log, are separated by the word — Reboot — .
3 – Past boots
In some circumstances, log information that was stored in past boots can be useful to system analysts. Since information about previous boots is saved in the journal, journalctl should be able to provide administrators with such information easily.
By default, log files that are produced by journald are not persistent, i.e. they are volatile, since they are stored in memory in the directory /run/log/journal and vanish after a reboot. If the memory storage limit is reached, the oldest entries will be deleted. This setting can be changed however. In order to allow persistent storage for Journal, two options are available :
a – The journal directory has to be created manually as shown below using the command (as root):
mkdir -p /var/log/journal/
Once this is done, restart journald daemon to apply the changes. This is done by running the command :
systemctl restart systemd-journald
Enabling persistent logging will help system administrators troubleshoot problems but this will require additional disk space though.
Read: How to fix high memory usage in Linux
b – Edit the configuration file of the journal as follows:
sudo nano /etc/systemd/journald.conf

Once the file is opened, scroll all the way down to the section entitled [Journal] :
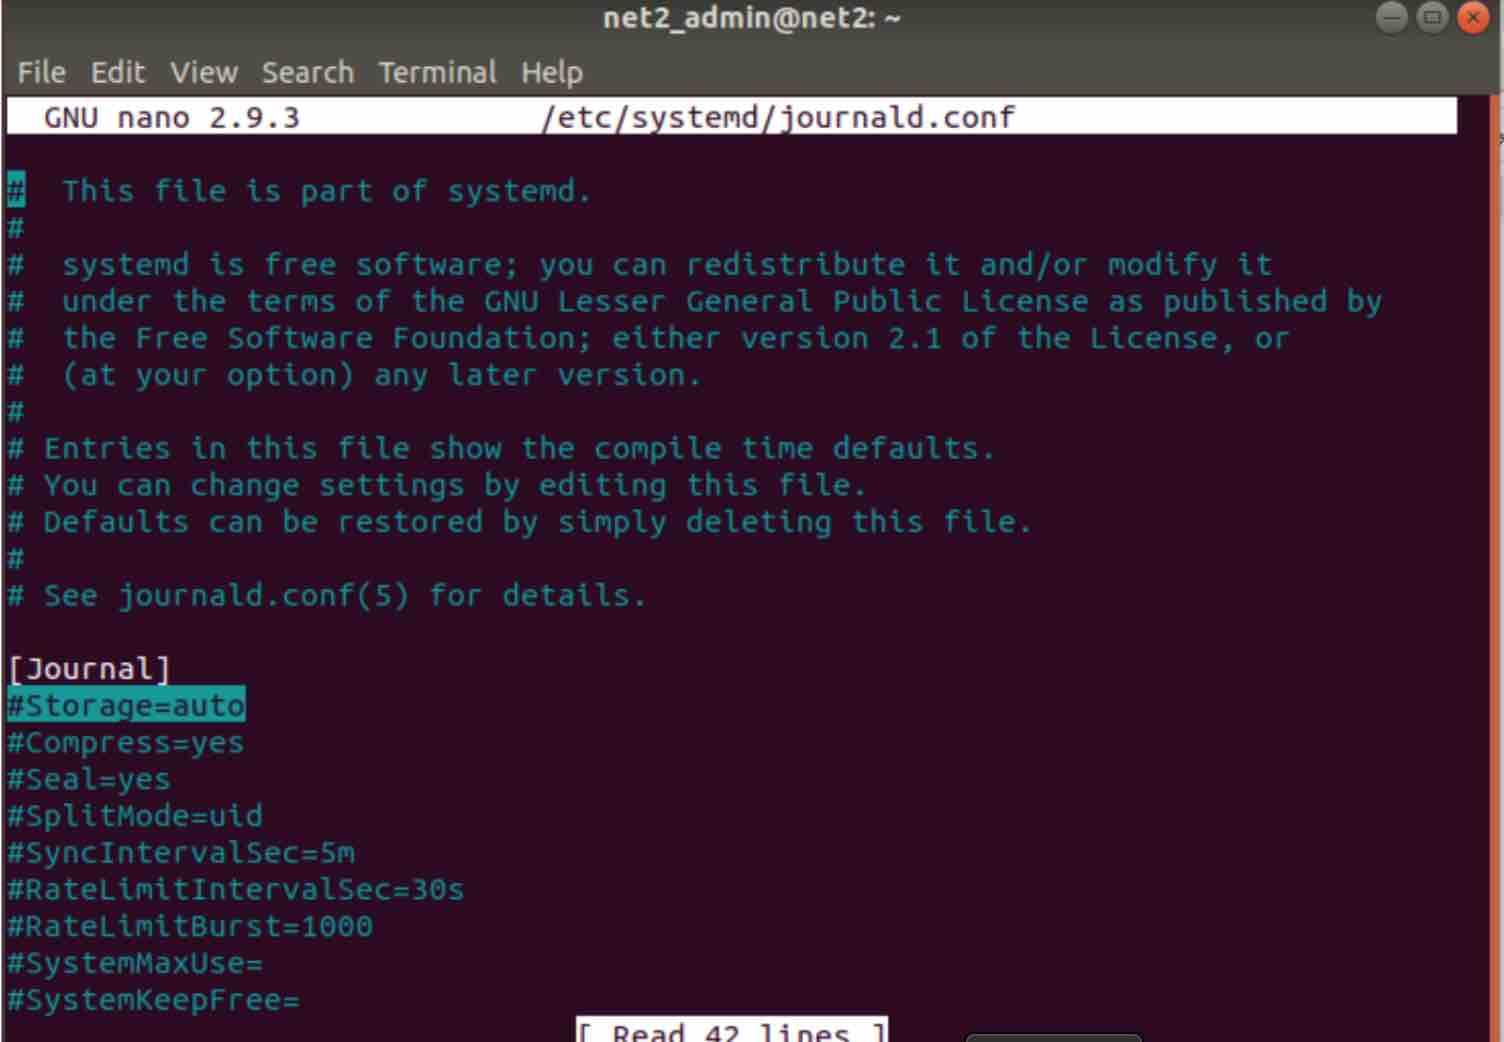
And set the ‘Storage=’ attribute (highlighted above) to “persistent” in order to allow persistent logging. Here are the four possible values for this attribute :
- none: all storage is turned off and all log records received will not be accepted, i.e. dropped. Redirecting to syslog loket, console, or kernel log buffer would still be operational.
- volatile: journal log data is stored only in active memory (not on disk) and would be available temporarily under the directory /run/log/journal. The directory will however be created if it was not available.
- persistent: journal log data will be saved on disk under the directory /var/log/journal which will be created if it did not exist. If the disk partition is not writable or accessible, the files will be stored under /run/log/journal directory.
- auto: similar to the persistent attribute but if the /var/log/journal directory does not exist, it will be created under the directory /run/log/journal.
4 – List available boots
In order to view the boots that journalctl is aware of , use the command below :
journalctl –list-boots
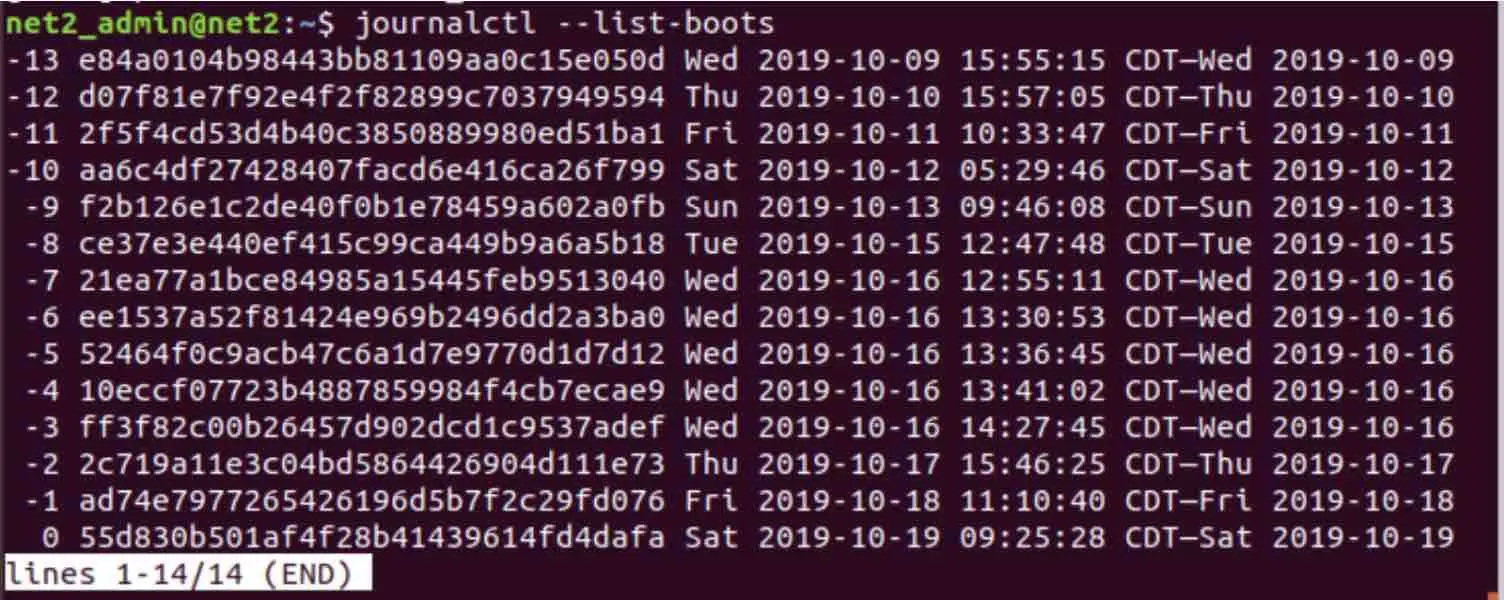
Journalctl previous boot information
Each line above corresponds to a previous boot.The second column represents the boot ID which is an absolute reference unlike the first column which is just the offset for the boot. Towards the end of each line, you will find the time the corresponding boot session refers to.
The first or the second column can be used to display information about specific boots. For example, to view the journal from the boot prior to the previous, use the -2 index with the -b switch as follows:
journalctl -b -2
Where we expect the date to be oct/17 :
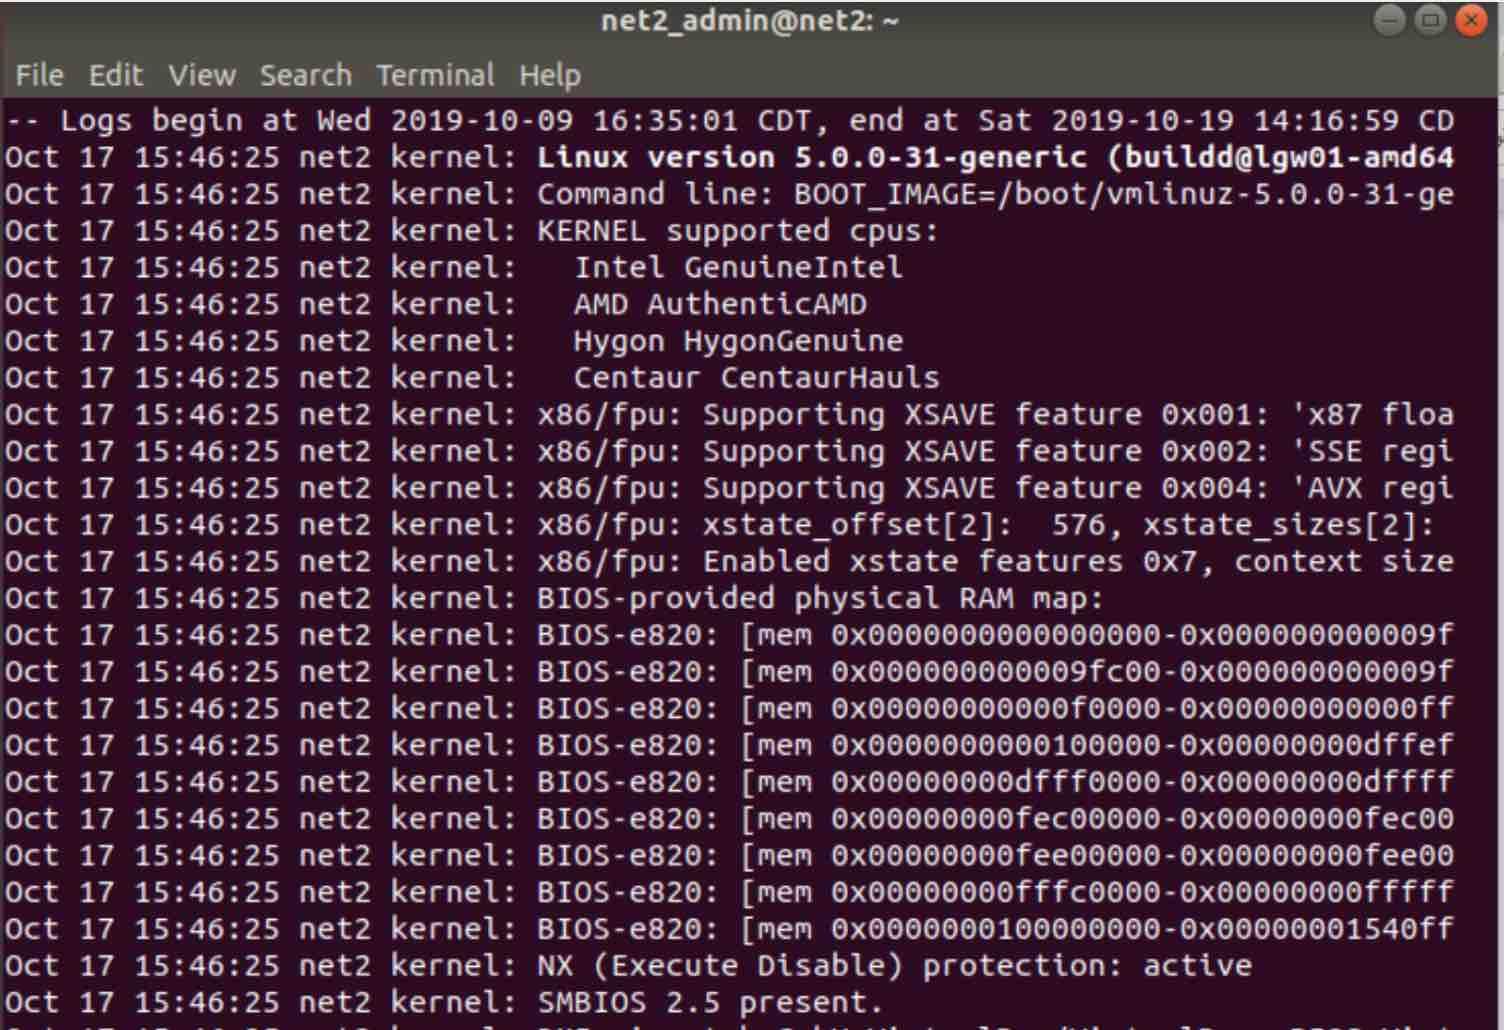
Using the second column would yield the same result, similarly :
journalctl -b 2c719a11e3c04bd5864426904d111e73
5 – Most recent logs display
In order to display the most recent record entries, you can use the n switch with –lines option as follows (like tail -n ):
journalctl –lines n

Analyze log files
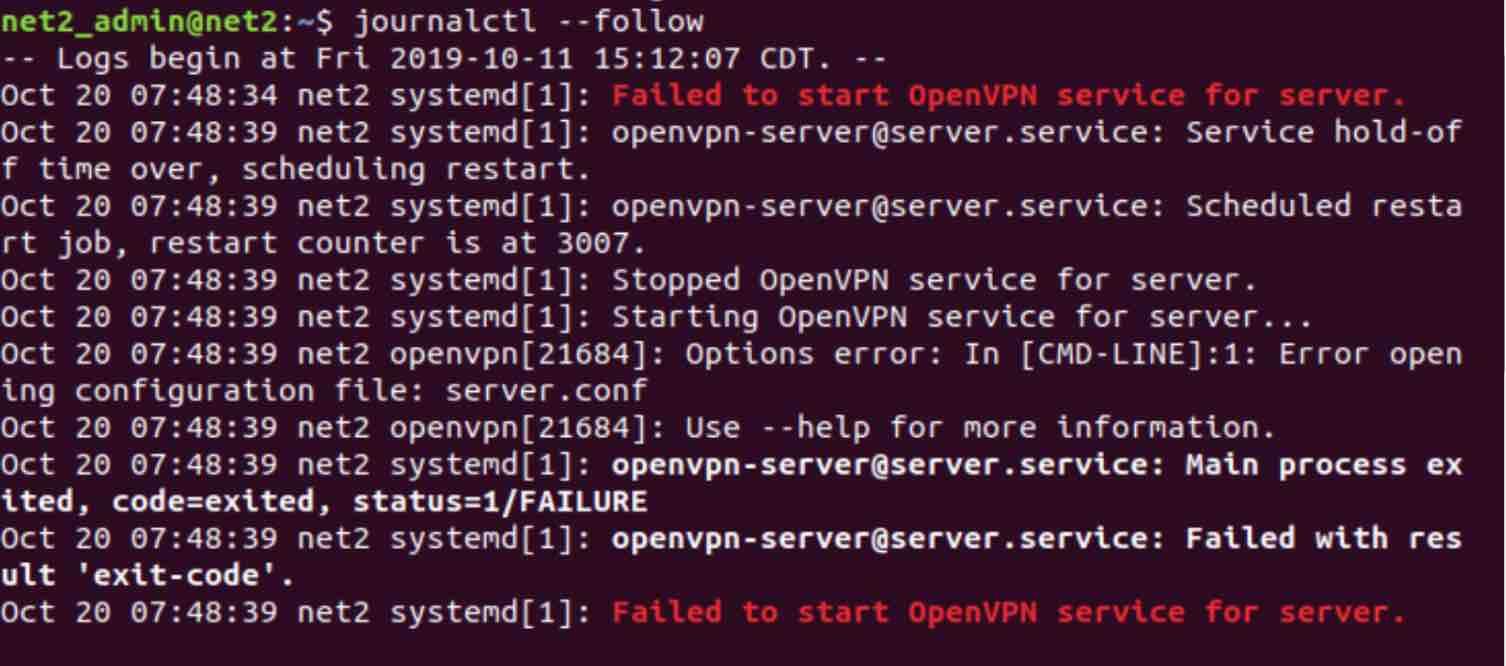
Furthermore, to see the entries being printed continuously, use the –follow attribute :
6 – Filtering by service
In this section, you will learn how to filter the log data based on a specific service. The systemd journal offers several ways to perform this.
Read: How to use systemd to troubleshoot Linux problems
a – By Service unit
In order to filter the logs according to service unit, you could use the -u option as follows :
journalctl -u ssh.service
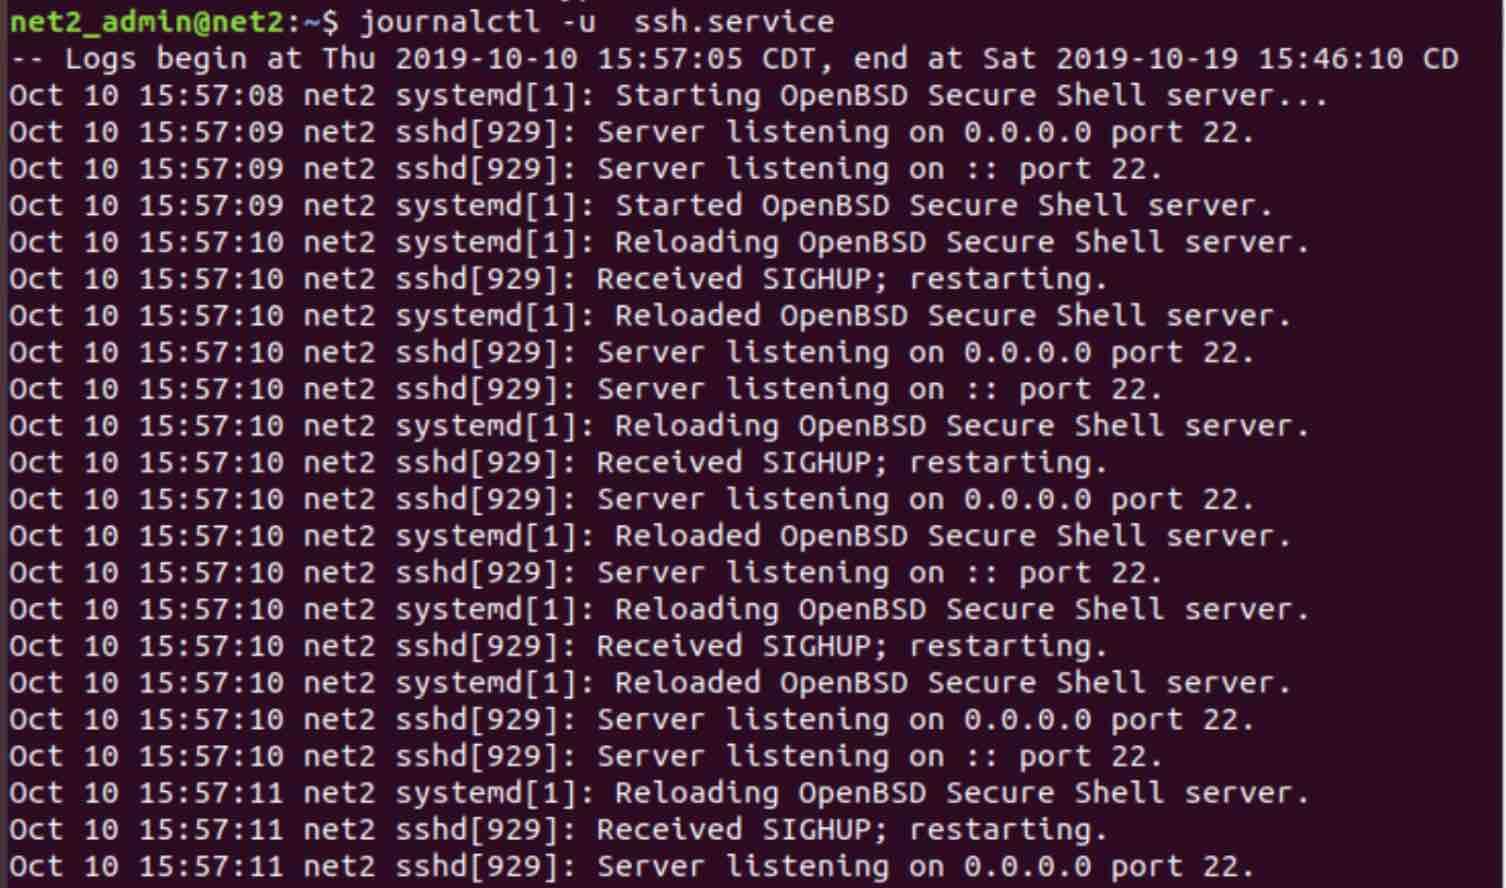
Where we have specified the ssh service unit.
Read: Ubuntu/Debian monitoring tools guide for system administrators
We can also add the aforementioned time filters , such as :
journalctl -u ssh.service –since yesterday –until today
It is also possible to query the logs which correspond to more than one service unit so that the returned results will be merged from these units in chronological order, for instance :
journalctl -u ssh.service -u mysql.service –since yesterday
This can be very useful for problem analysis especially when services are dependent on each other or they have some kind of functional interactions.
b – Filtering by Process ID
In case you have the PID (process id) of a process that you would like to investigate, or that you are interested in, you could search the logs by filtering on the PID as follows :
journalctl _PID=901
Where you have to use the _PID argument of journalctl command. Here the PID we are looking for is 901.
c – Filtering by User or Group ID
In order to display all entries for a given user or group, you can use the _UID for the user ID or _GID for the group.
To filter the journal log data using a user ID , type in the command below:
journalctl _UID=844 –since today
If you know the user name and want to retrieve the ID, just type in the command below :
id – u user_name
7 – How to display a filter unique values ?
There is a pretty useful feature of journalctl command which allows you to display all unique values of a given filter. For instance you would like to display all the available values of the field user id (UID) that are stored in the journal. This can be done very easily using the -F option as follows :
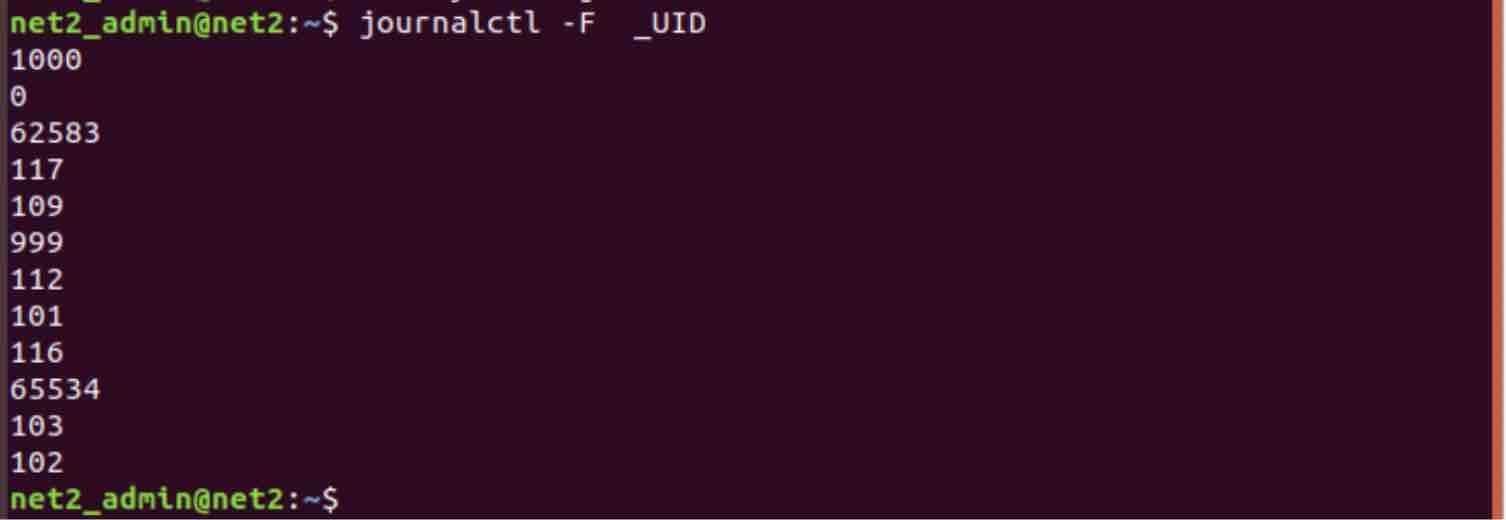
This can be done for any other field, like _PID, _GID…
8 – Displaying Kernel Messages
In order to retrieve kernel messages which are usually available in dmesg output,you can add the -k or –dmesg options to journalctl command as follows:
journalctl -k
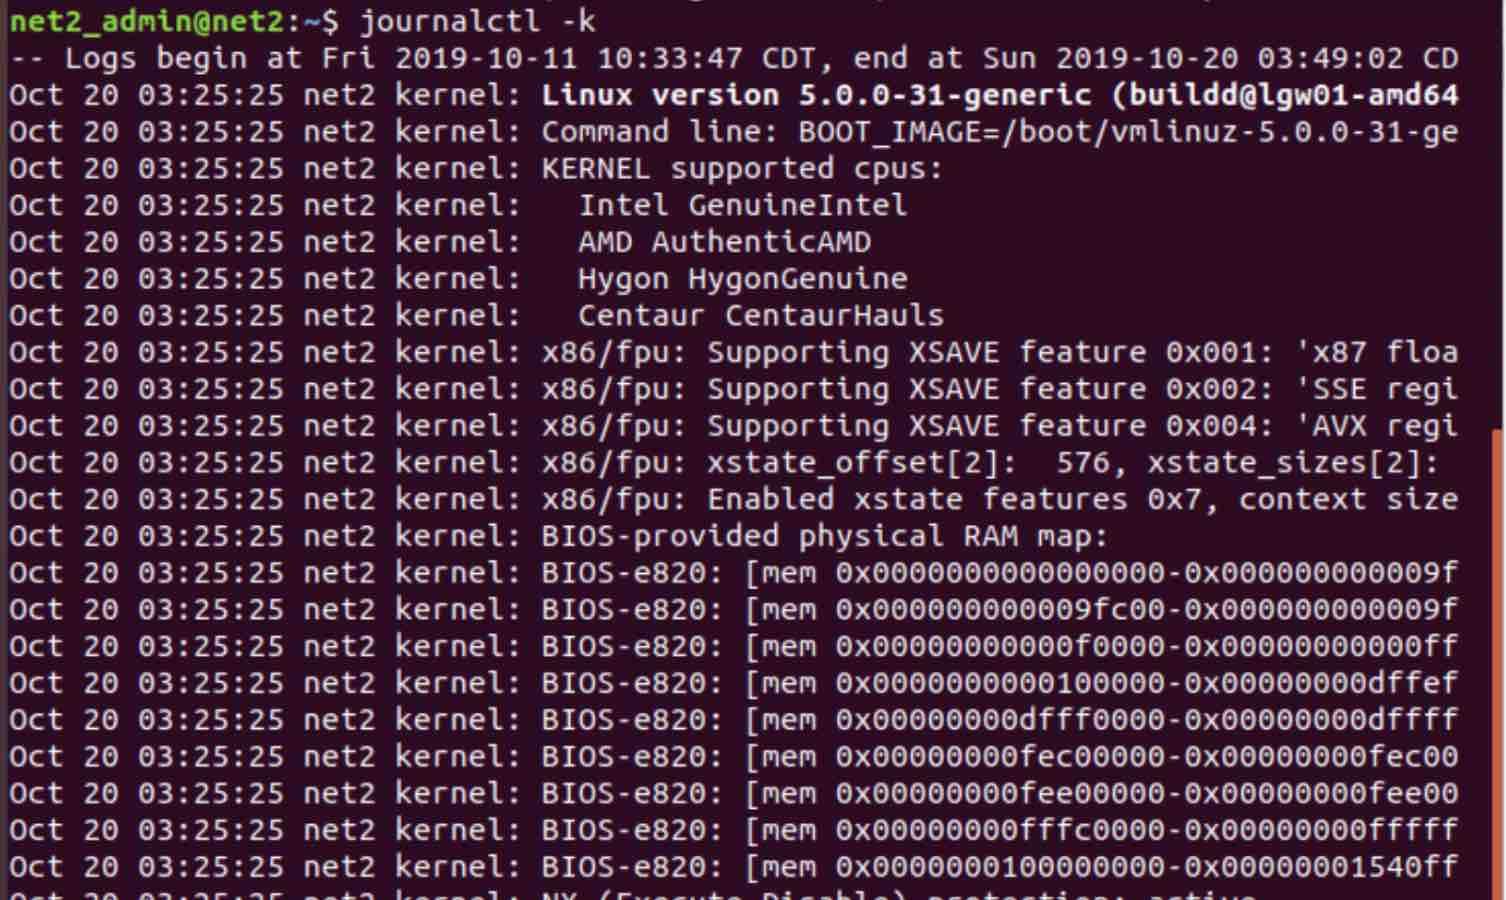
The kernel messages above will be displayed from the current boot (by default). In order to specify kernel messages from previous boots, you just need to use the boot selection flags that we mentioned previously. For example, to find kernel messages from 4 boots ago, run the command as follows:
journalctl -k -b -4
9 – Filtering by message priority
Oftentimes, system administrators are looking for messages with the highest priority in the journal since almost always, low priority logs might be irrelevant and confusing.
To display only messages of specific priority, you can use the -p option as shown below.
For example, to view the entries which contain error,critical, alert or emergency messages type in the command below :
journalctl -p err -b
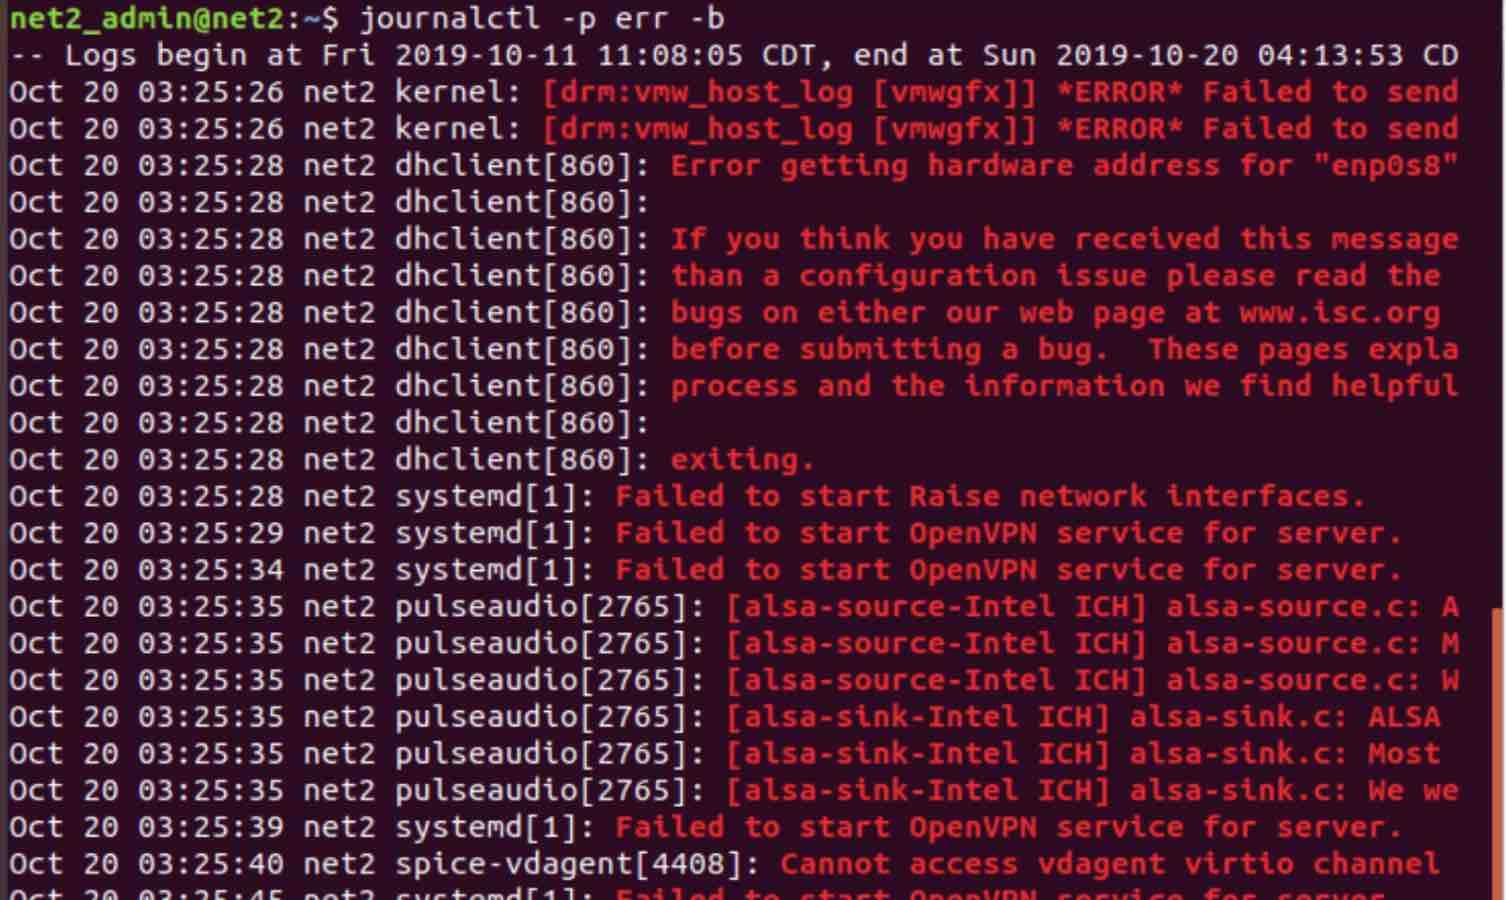
The journal uses the syslog standard message levels. The priority name or its corresponding numeric value can both be used. The following are the priority level names ordered from the highest to the lowest:
0: emerg 1: alert 2: crit 3: err 4: warning 5: notice 6: info 7: debug
The names or numbers above can be used with the -p option (for more filtering, use a journalctl grep combination).
Conclusion
The systemd journal is incredibly rich in filtering options. These advanced features of linux logging commands could very useful for system administrators in order to help collect, debug and analyze log events to solve system and applications issues.
If you like the content, we would appreciate your support by buying us a coffee. Thank you so much for your visit and support.
Original page link
Best Cool Tech Gadgets
Top favorite technology gadgets


0 comments:
Post a Comment